Key Numbers
Financial Indicators
| (€ million) | 2025 | 2024 | Variation (%) | |
|---|---|---|---|---|
| Change (reported) | Change (at constant scope and exchange rates) | |||
| Consolidateed sales | 3 854 | 3 884 | -0.8% | +3.3% |
| EBITDA | 771 | 783 | -1.6% | +41.0% |
| EBITDA margin (%) | 20 | 20.2 | -0.2 pts | |
| EBIT | 445 | 457 | -2.7% | +4.0% |
| EBIT margin (%) | 11.5 | 11.8 | -0.3 pts | |
| Consolidated net income | 307 | 290 | +5.7% | +11.9% |
| Net margin (%) | 8.0 | 7.5 | +0.5 pts | |
| Consolidated net income, Groupe share | 275 | 273 | +0.8% | +6.0% |
| Cash flow | 324 | 373 | -13.0% | |
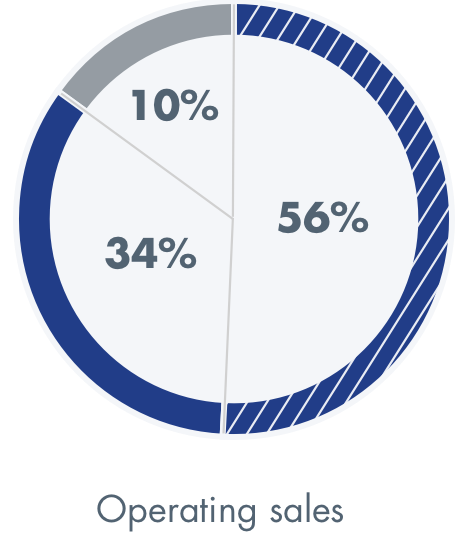
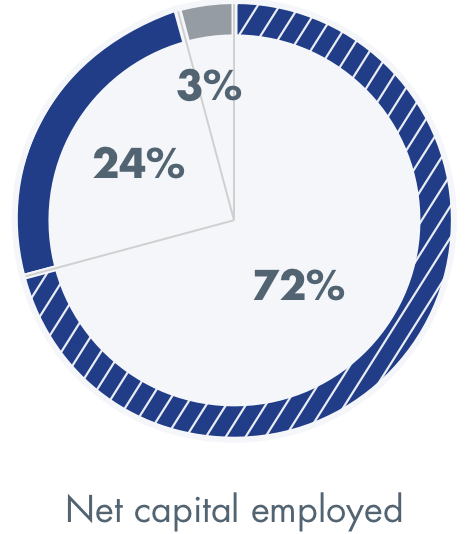
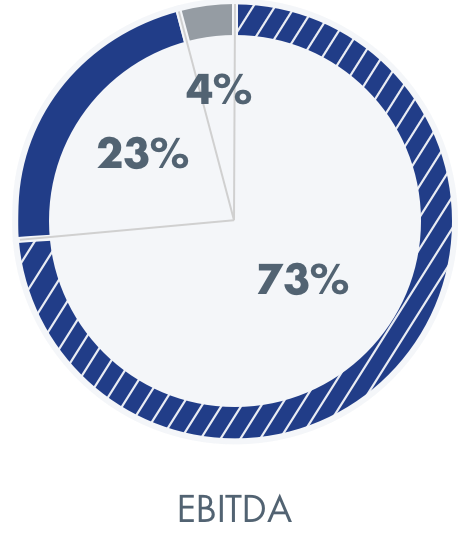
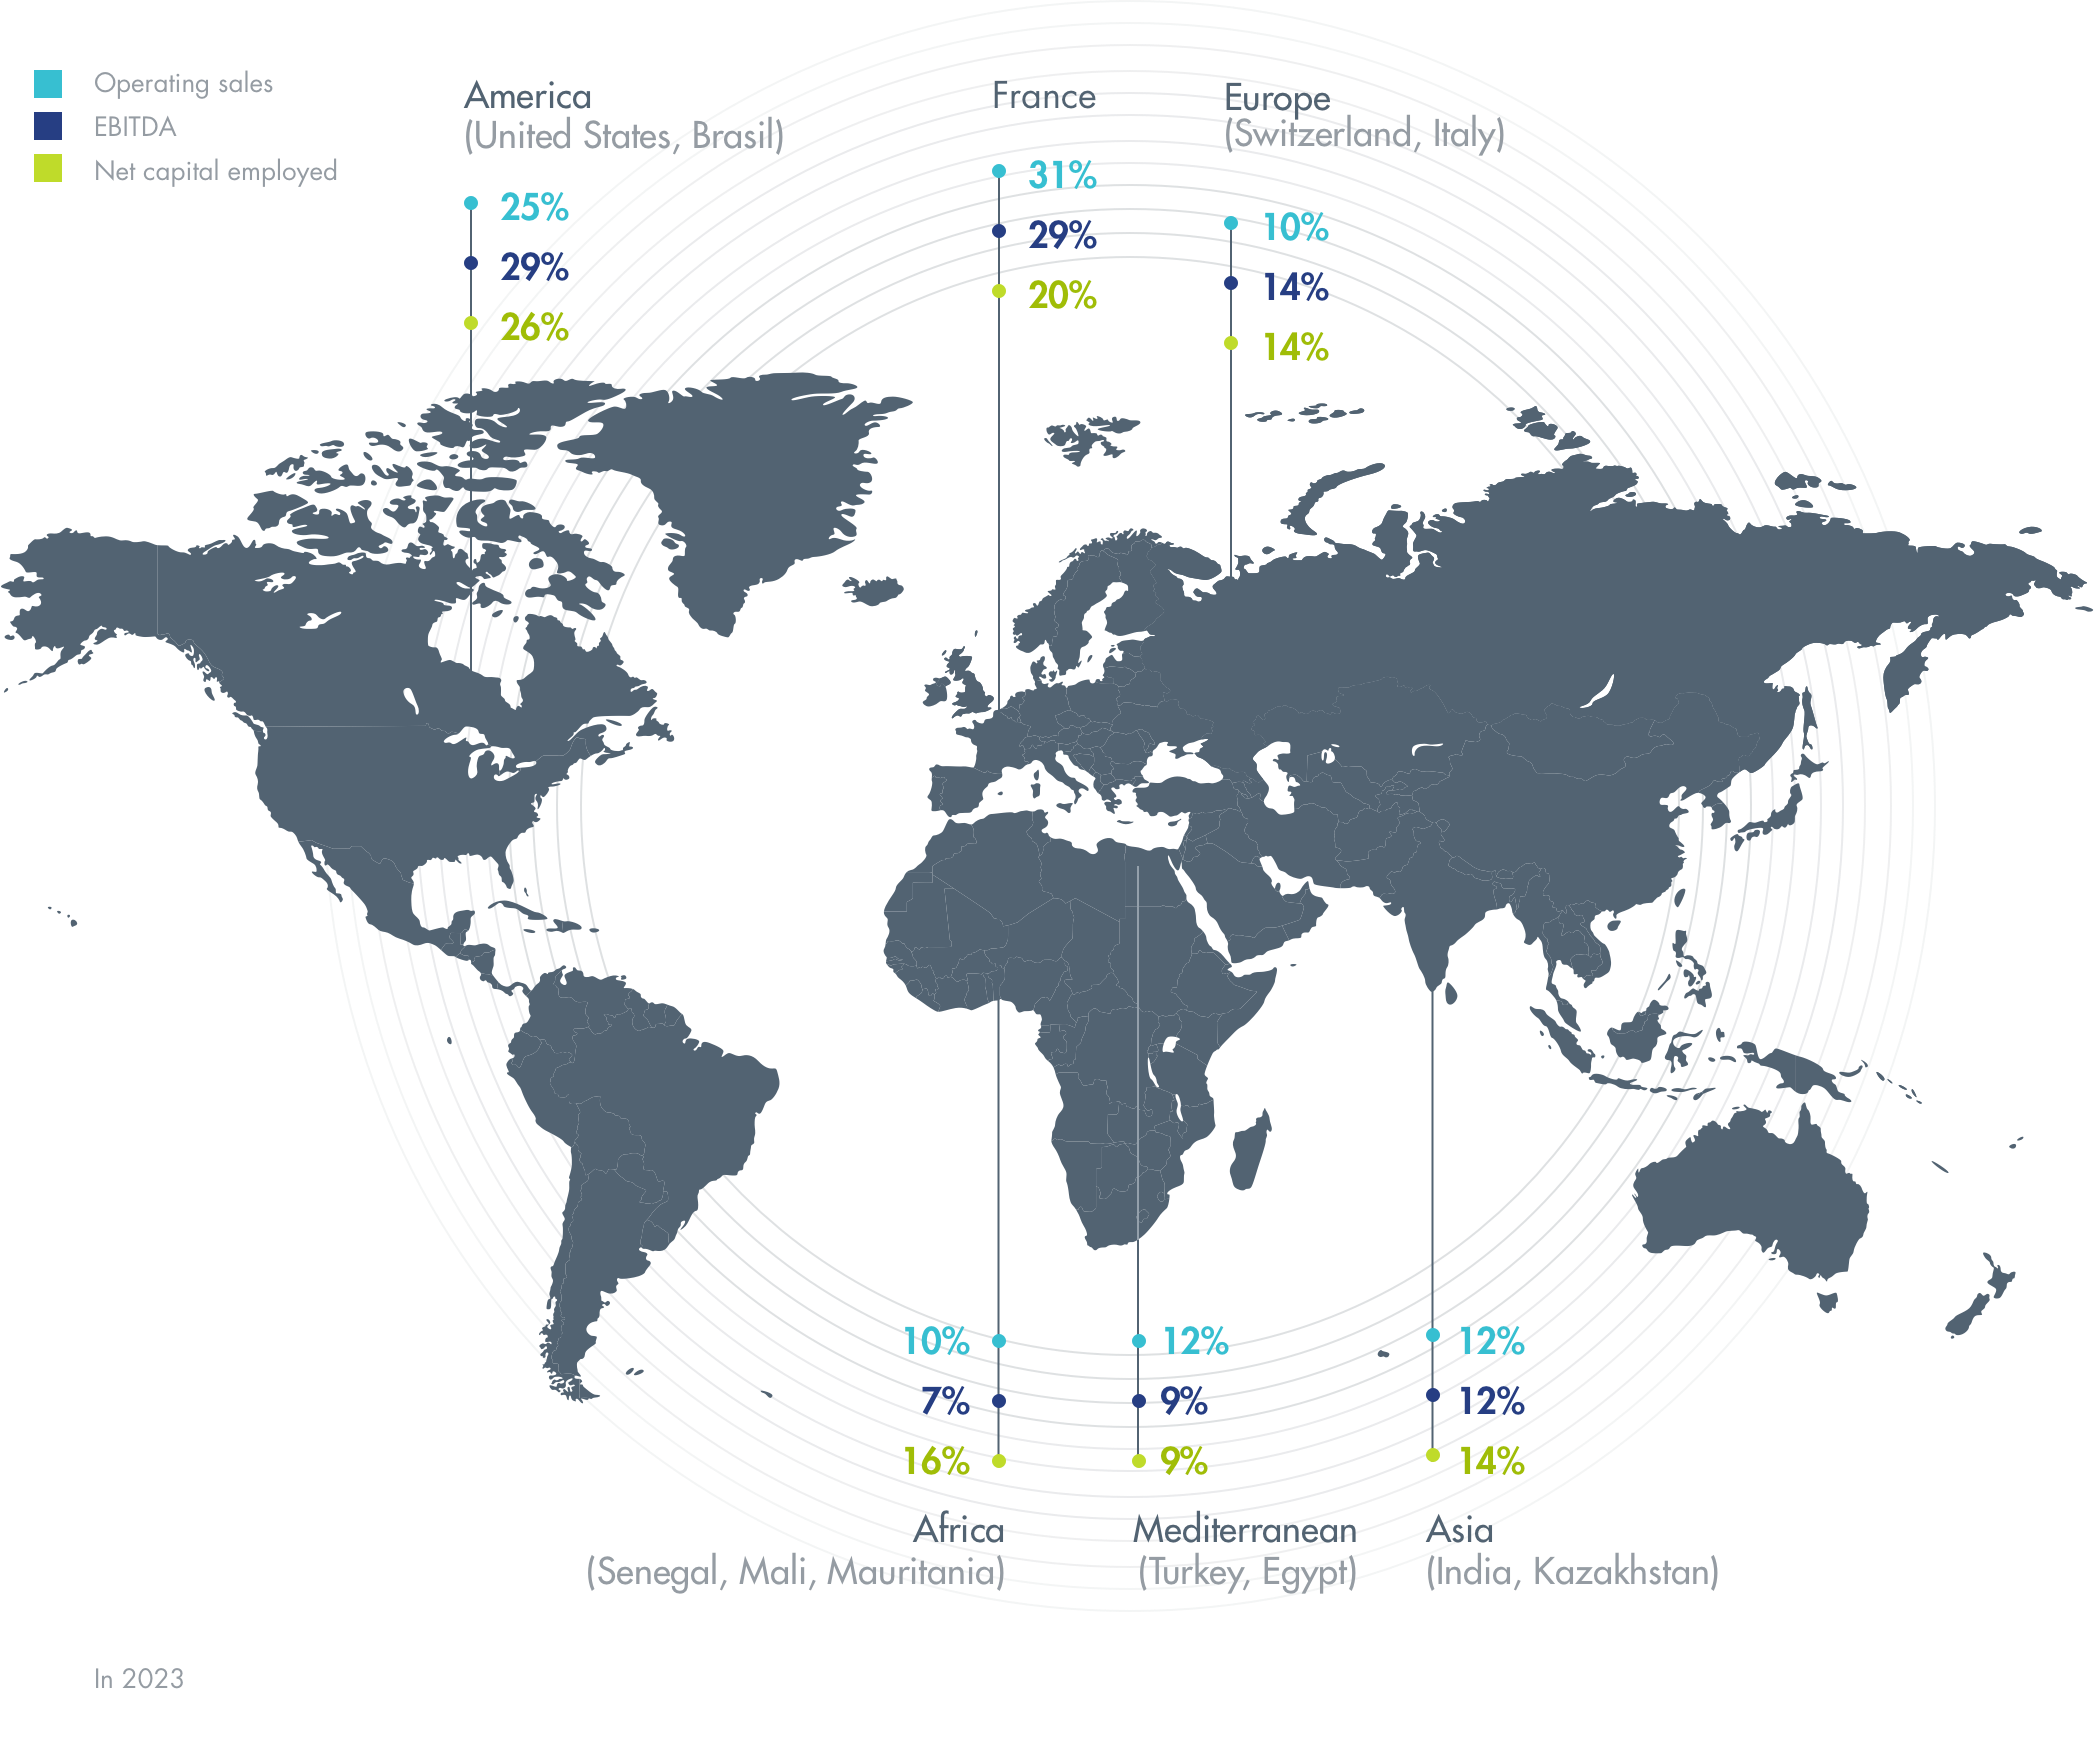
Breakdown per geographical area 2023
Breakdown per business in 2023